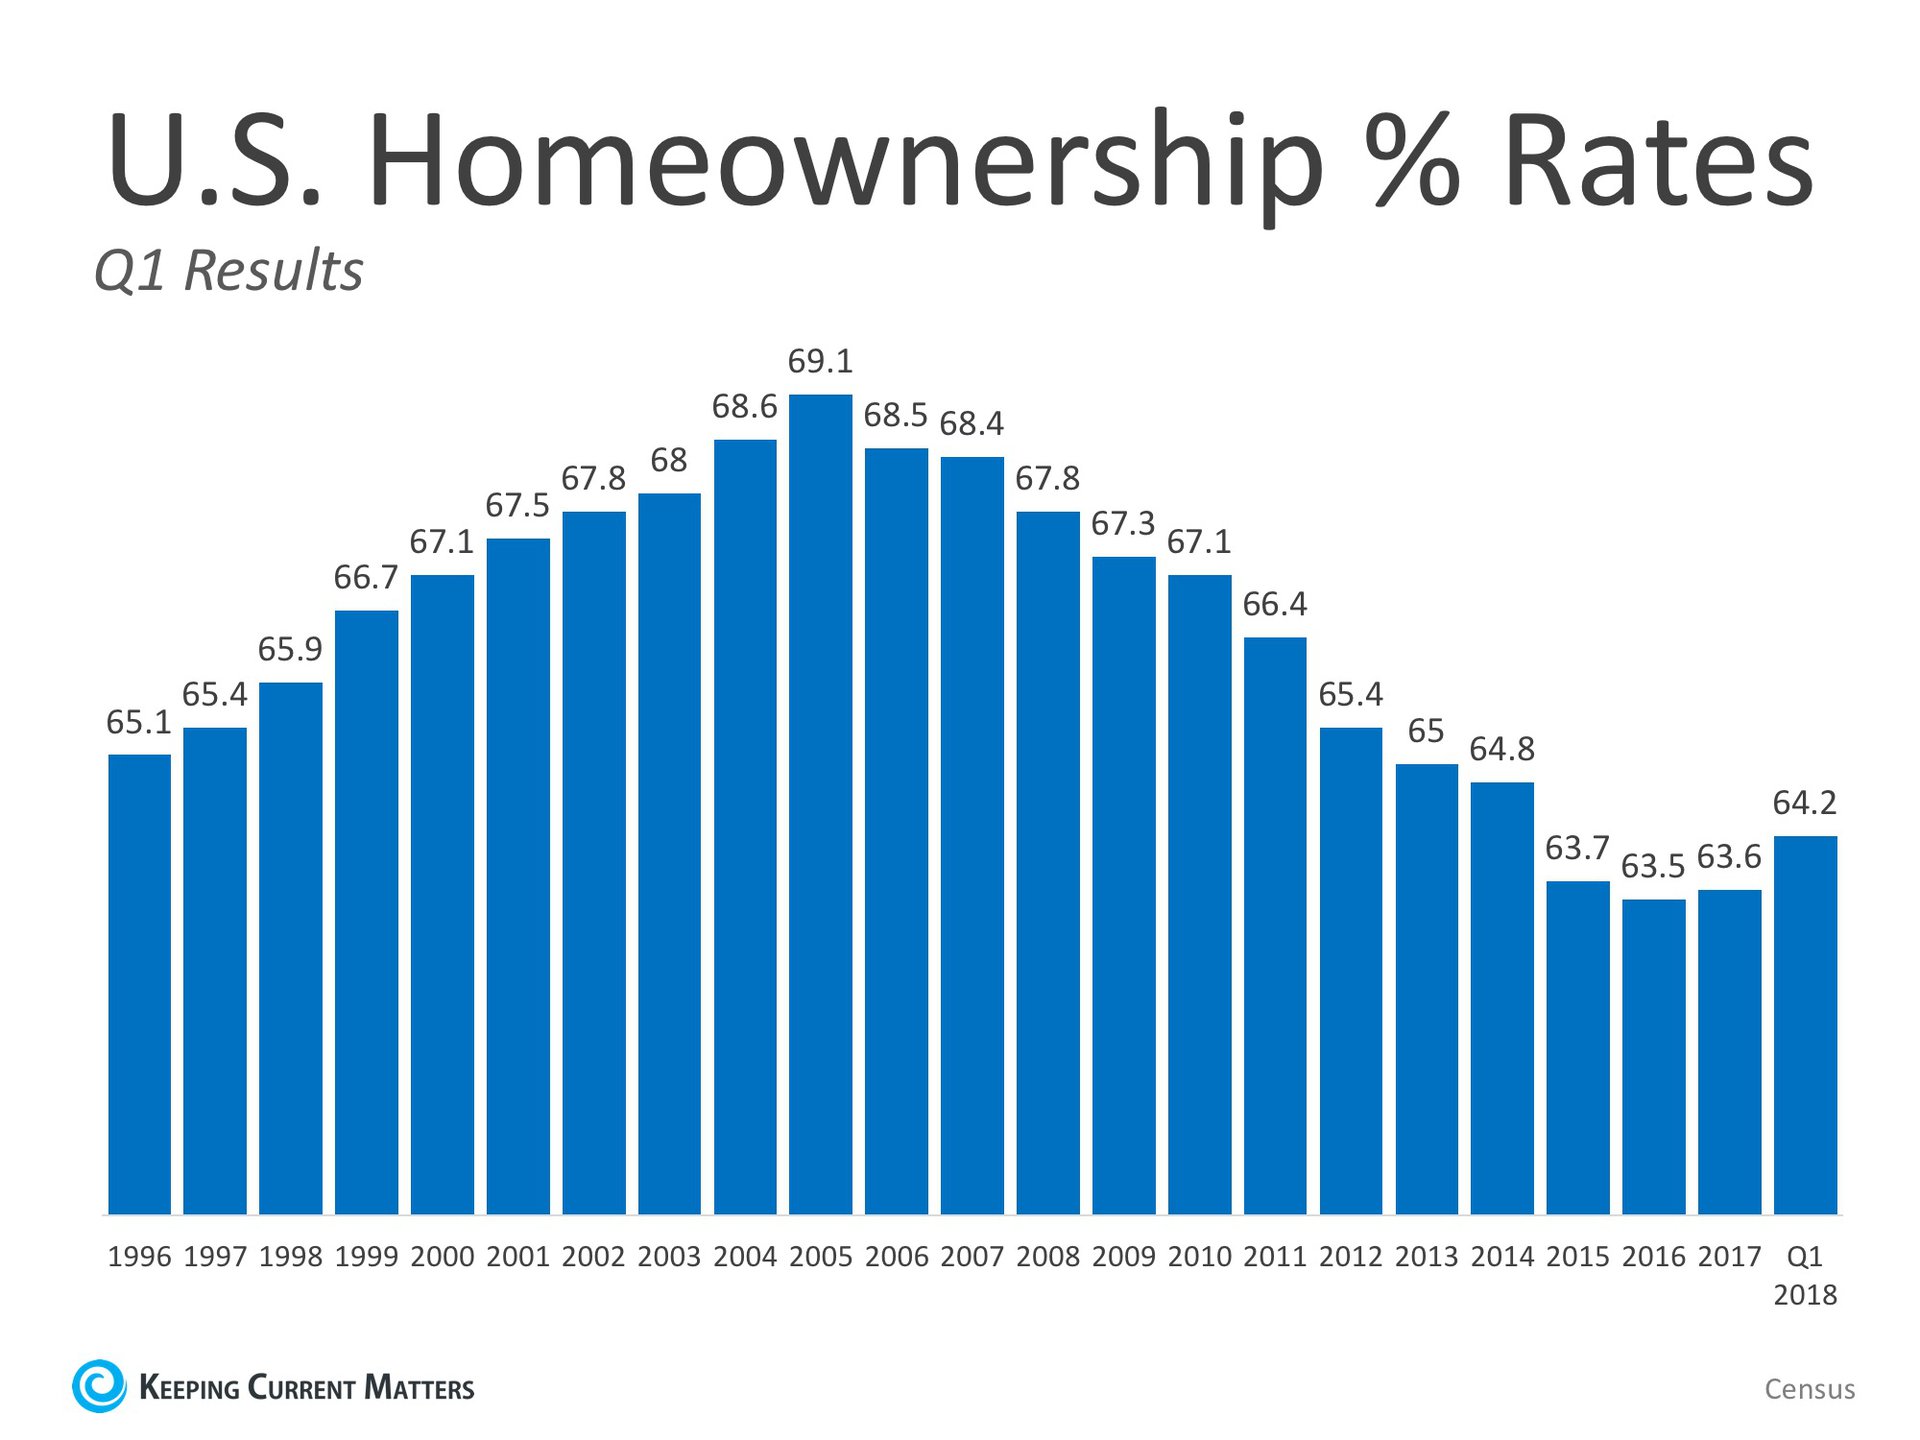
The famous quote by Walt Whitman, “A man is not a whole and complete man, unless he owns a house and the ground it stands on,” can be used to describe homeownership in America today. The Census revealed that the percentage of homeowners in America has been steadily climbing back up since hitting a 50-year low in 2016. The homeownership rate in the first quarter of 2018 was 64.2%, higher than last year’s 63.6%. Chief Economist, Dr. Ralph McLaughlin, in his VUE Blog gave these new homeownership numbers some context: “The trend is clear: the homeownership rate has been ticking up for five consecutive quarters, and the number of new renter households has fallen for four consecutive quarters. Owner-occupied households grew by 1.345 million from a year ago, while the number of renters actually fell by 286,000 households. The fact that we now have four consecutive quarters where owner households increased while renter households fell is a strong sign households are making a switch from renting to buying. This is a trend that multifamily builders, investors, and landlords should take note of.” In a separate article comparing the rental population in America to the homeowner population, Realtor.com also concluded that the gap is now shrinking: “The U.S. added 1.3 million owner households over the last year and lost 286,000 renter households, the fourth consecutive quarter in which the number of renter households declined from the same quarter a year earlier. That could pose challenges for apartment landlords, who are bracing this year for one of the largest infusions of new rental supply in three decades.” America’s belief in homeownership was also evidenced in a survey conducted by Pew Research. They asked consumers “How important is homeownership to achieving the American Dream?” The results:
Homeownership has been, is, and always will be a crucial part of the American Dream. |

Find Homes For Sale in the Savannah, GA, Area
Real Talk
When it comes to making a great real estate investment, knowledge is key. Our blog provides the essential information you'll need to make your next move.
Homeownership: "A Man Is Not a Complete Man, Unless He Owns a House"?
What If I Wait Until Next Year to Buy a Home?
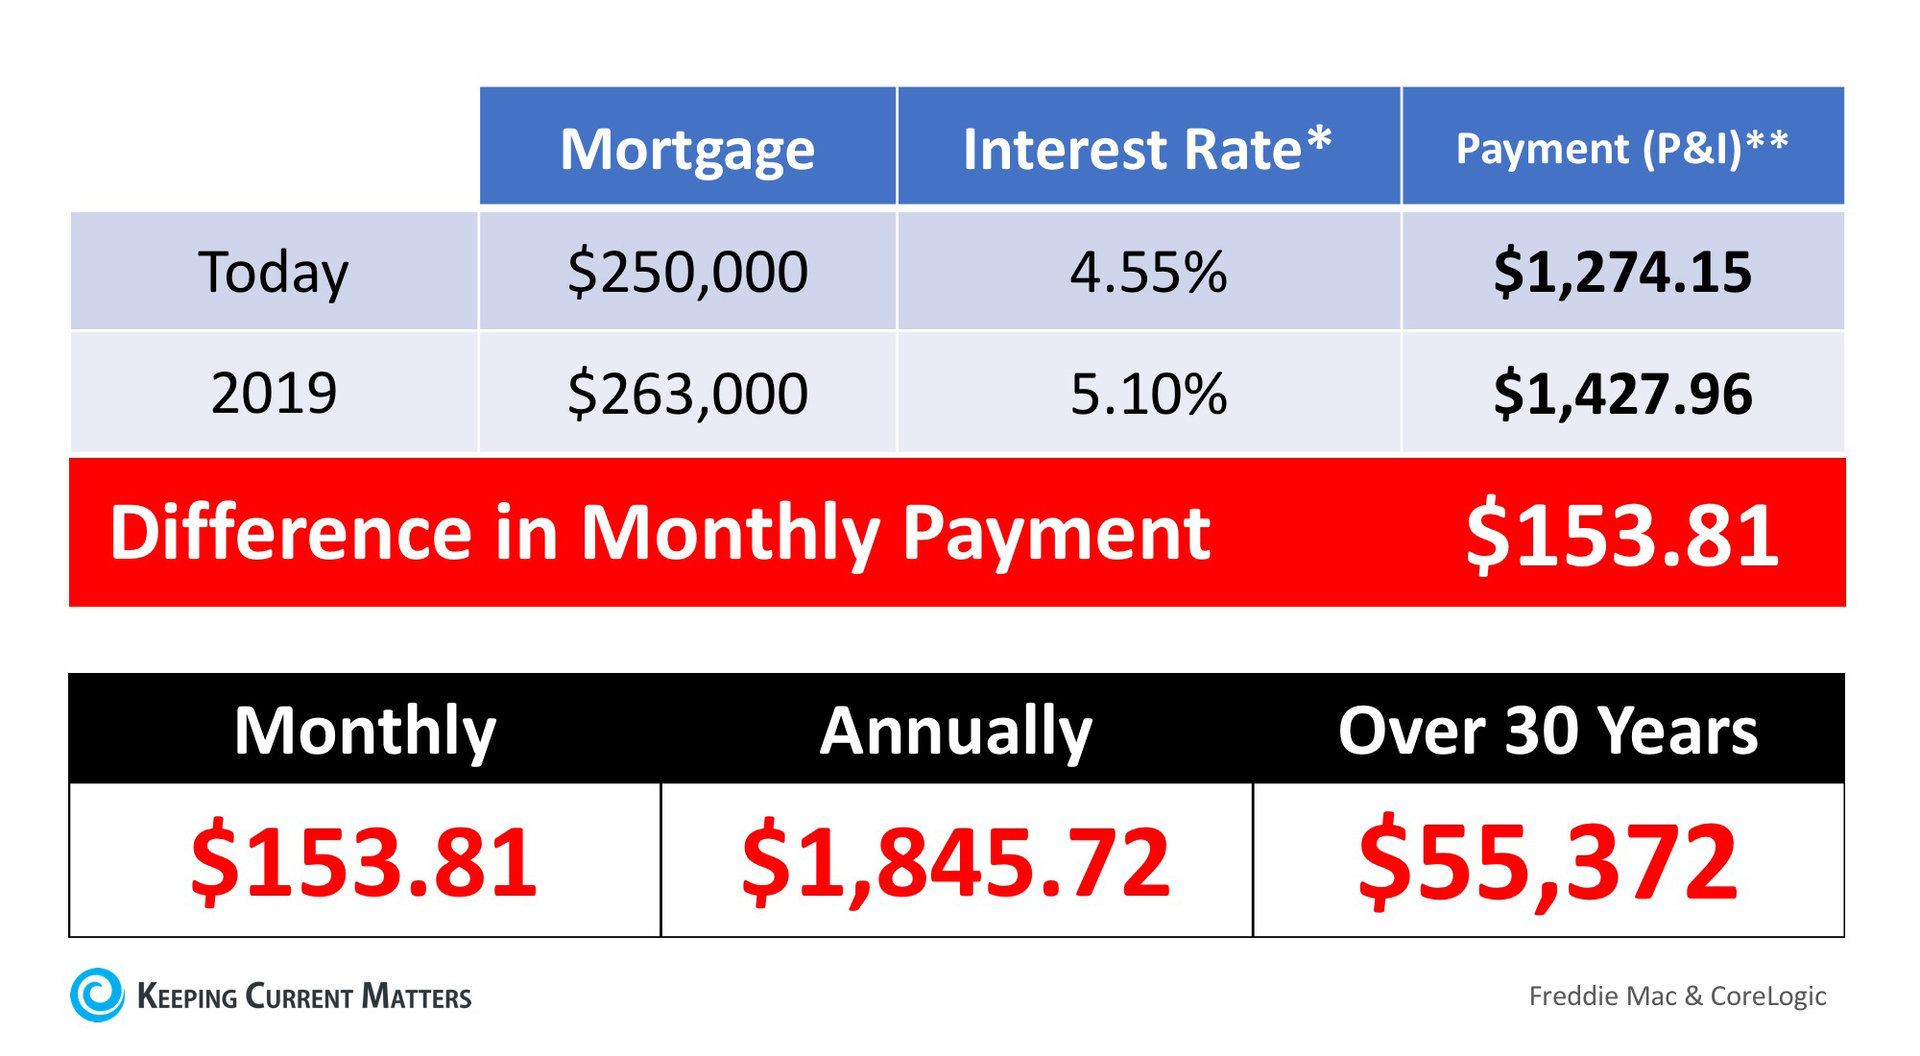
 We recently shared that national home prices have increased by 6.7% year-over-year. Over that same time period, interest rates have remained historically low which has allowed many buyers to enter the market. As a seller, you will likely be most concerned about ‘short-term price’ – where home values are headed over the next six months. As a buyer, however, you must not be concerned about price, but instead about the ‘long-term cost’ of the home. The Mortgage Bankers Association (MBA), Freddie Mac, and Fannie Mae all project that mortgage interest rates will increase by this time next year. According to CoreLogic’smost recent Home Price Index Report, home prices will appreciate by 5.2% over the next 12 months. What Does This Mean as a Buyer?If home prices appreciate by 5.2% over the next twelve months as predicted by CoreLogic, here is a simple demonstration of the impact that an increase in interest rate would have on the mortgage payment of a home selling for approximately $250,000 today: Bottom LineIf buying a home is in your plan for this year, doing it sooner rather than later could save you thousands of dollars over the terms of your loan. |
Best Month to Sell Your Home
This Just In: Data Says May is the Best Month to Sell Your Home
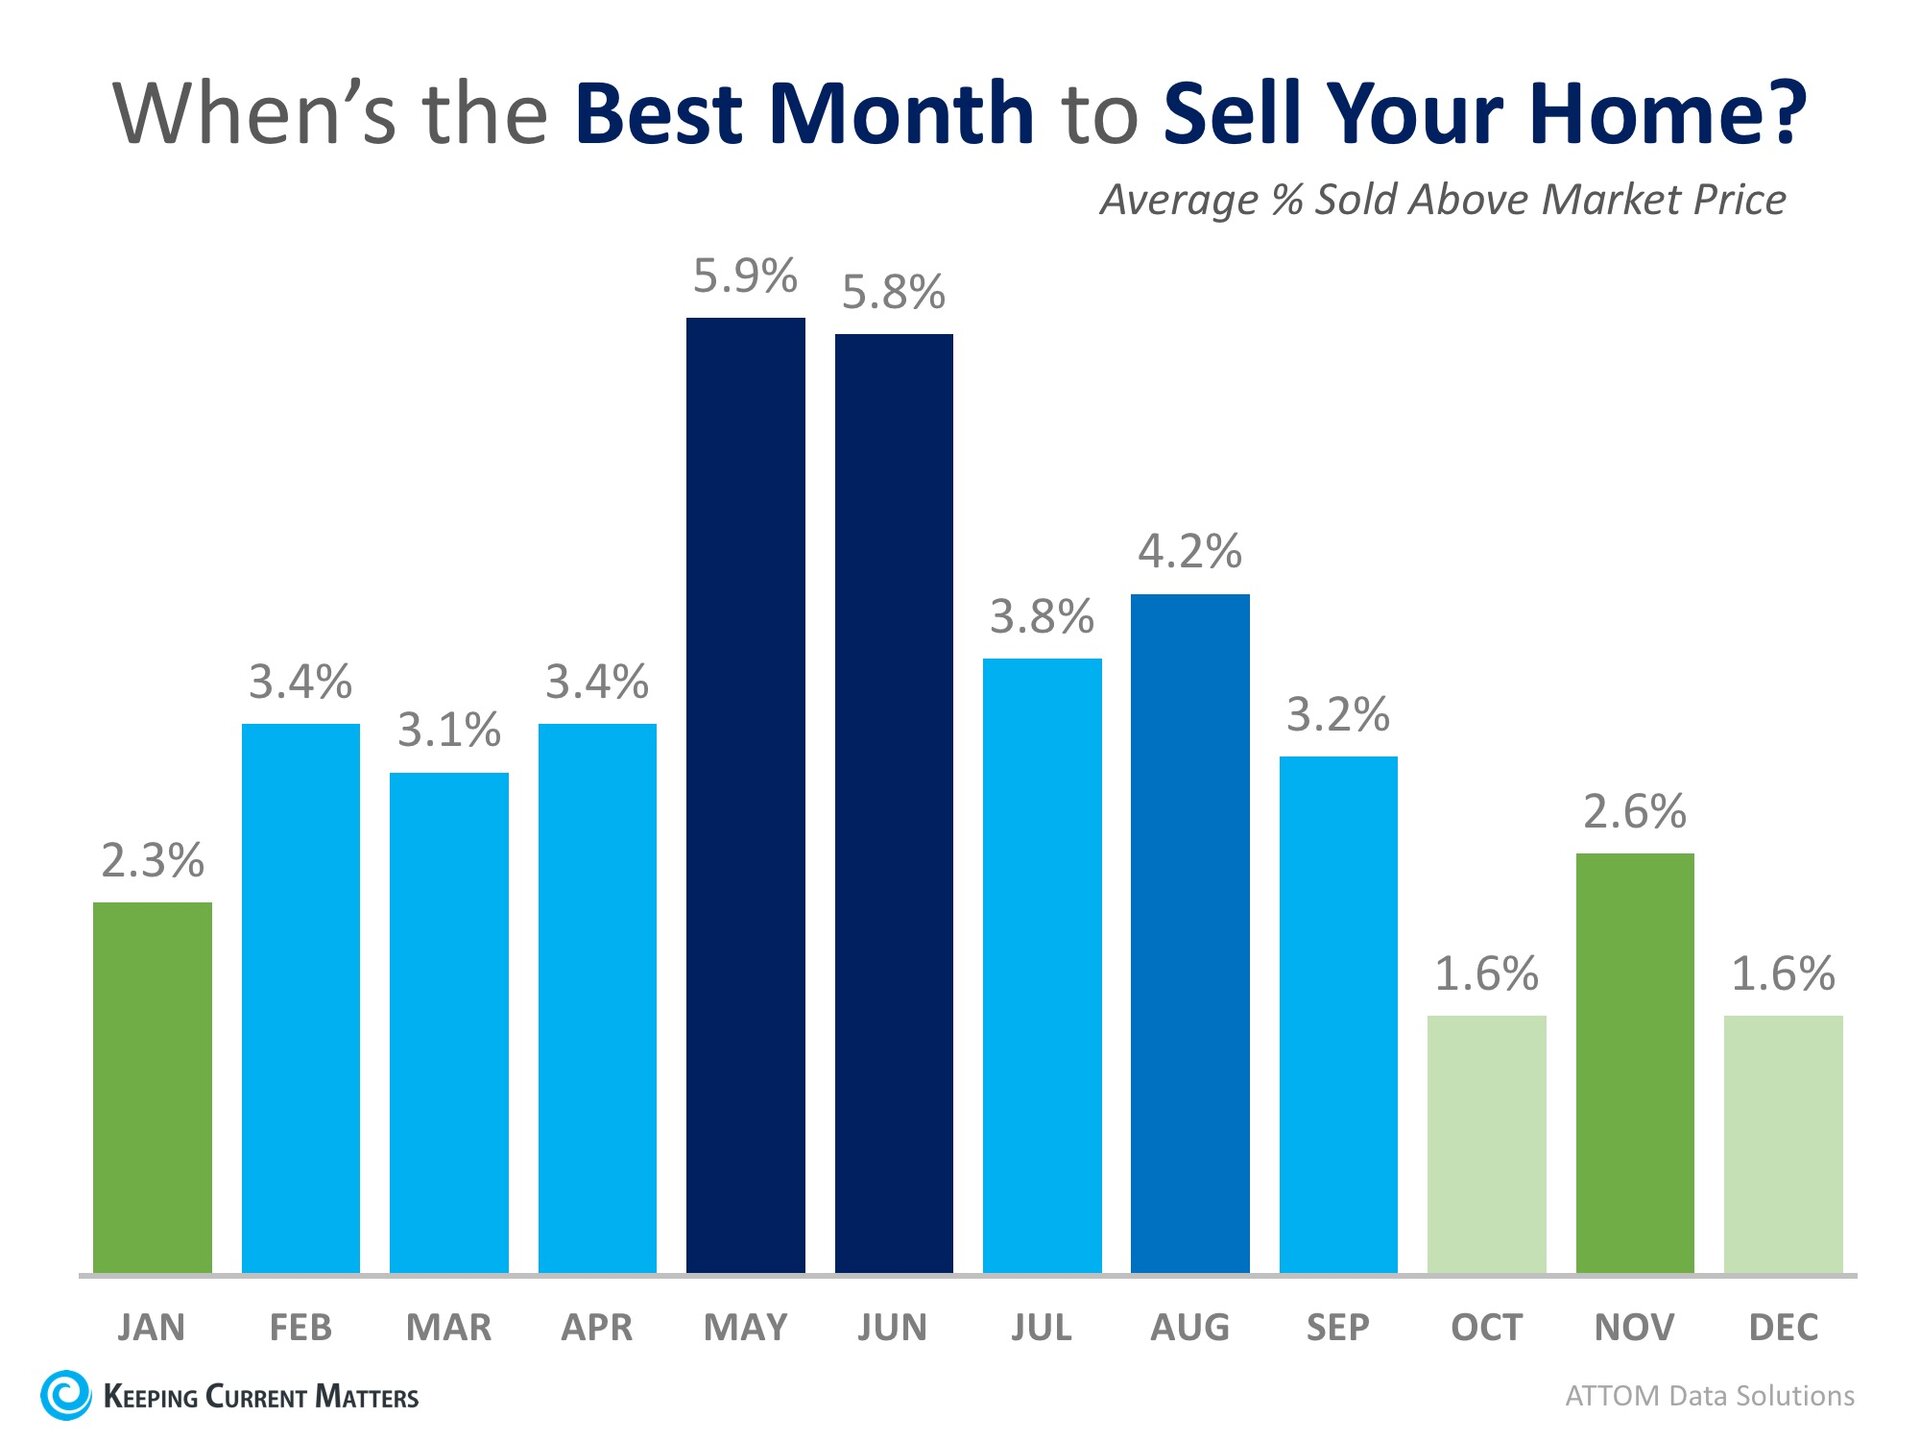
 According to a newly released study by ATTOM Data Solutions, selling your home in the month of May will net you an average of 5.9% above estimated market value for your home. For the study, ATTOM performed an “analysis of 14.7 million home sales from 2011 to 2017” and found the average seller premium achieved for each month of the year. Below is a breakdown by month: ATTOM even went a step further and broke their results down by day. Top 5 Days to Sell:
It should come as no surprise that May and June dominate as the top months to sell and that 4 of the top 5 days to sell fall in those two months. The second quarter of the year (April, May, June) is referred to as the Spring Buyers Season, when competition is fierce to find a dream home, which often leads to bidding wars. One caveat to mention though, is that when broken down by metro, ATTOM noticed that while warmer climates share in the overall trend, it turns out that they have different top months for sales. The best month to get the highest price in Miami, FL, for instance, was January, and Phoenix, AZ came in with November leading the charge. If you’re thinking of selling your home this year, the time to list is NOW! According to the National Association of Realtors, homes sold in an average of just 30 days last month! If you list now, you’ll have a really good chance to sell in May or June, setting yourself up for getting the best price! Bottom LineContact a local real estate professional who can show you the market conditions in your area and get the most exposure to the buyers who are ready and willing to buy! |
How Much Has Your Home Increased in Value Over the Last Year??
How Much Has Your Home Increased in Value Over the Last Year?
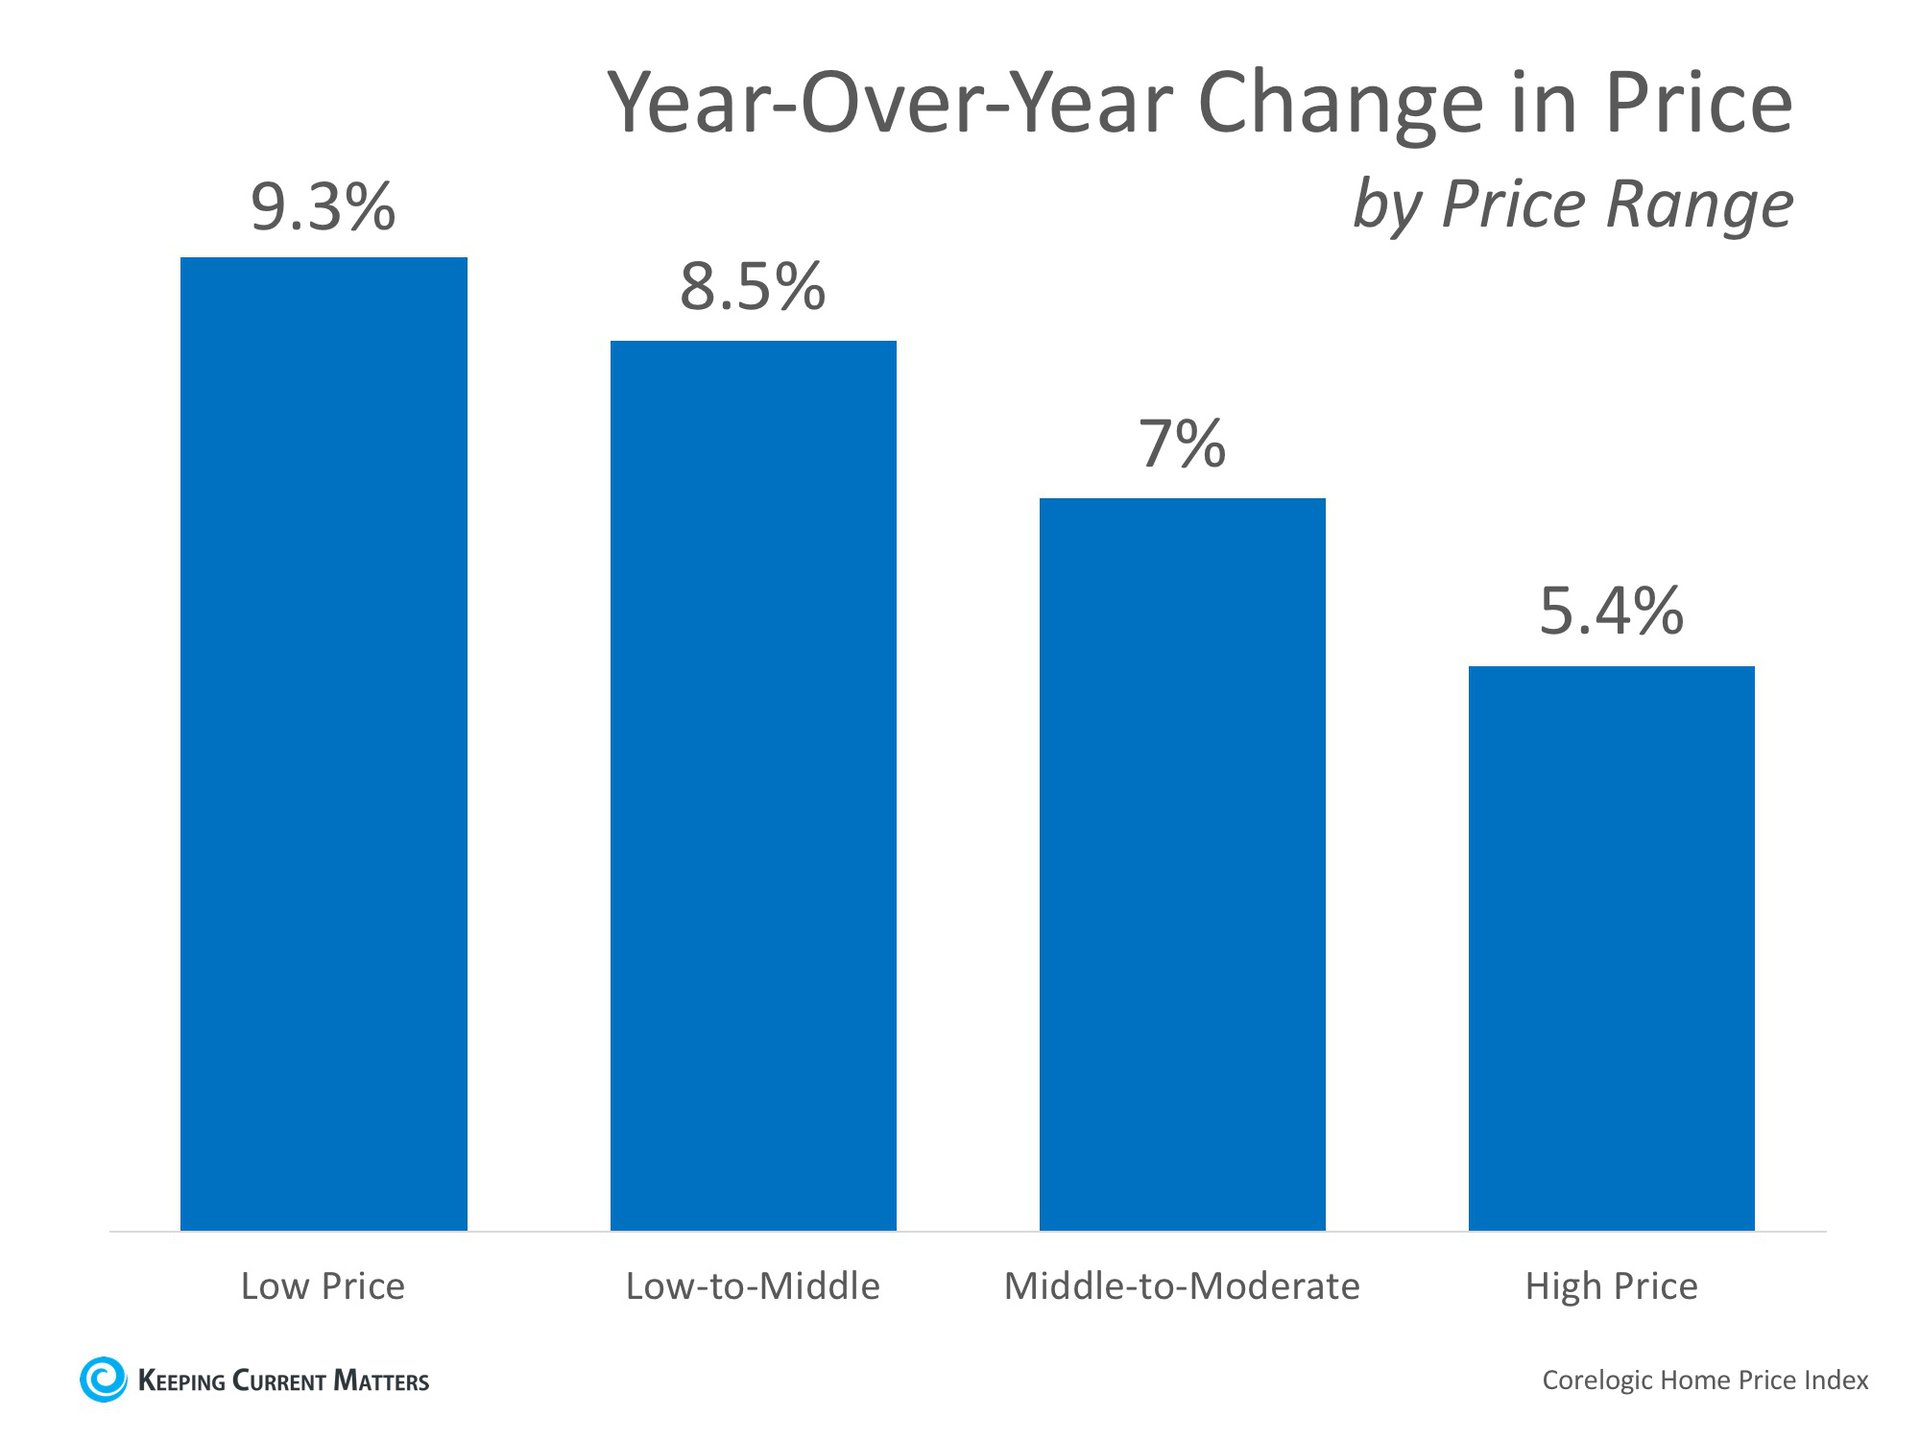
 Home values have risen dramatically over the last twelve months. In CoreLogic’s most recent Home Price Index Report, they revealed that national home prices have increased by 6.7% year-over-year. CoreLogic broke down appreciation even further into four price ranges, giving us a more detailed view than if we had simply looked at the year-over-year increases in national median home price. The chart below shows the four price ranges from the report, as well as each one’s year-over-year growth from February 2017 to February 2018 (the latest data available). It is important to pay attention to how prices are changing in your local market. The location of your home is not the only factor that determines how much your home has appreciated over the course of the last year. Lower-priced homes have appreciated at greater rates than homes at the upper ends of the spectrum due to demand from first-time home buyers and baby boomers looking to downsize. Bottom LineIf you are planning to list your home for sale in today’s market, find a local agent who can explain exactly what’s going on in your area and your price range. |
Existing Home Sales Grow Despite Low Inventory
Some Highlights:
|
![Existing Home Sales Grow Despite Low Inventory [INFOGRAPHIC] | Keeping Current Matters](https://files.keepingcurrentmatters.com/wp-content/uploads/2018/04/24163325/20180427-EHS-Report-KCM-ENG.jpg)
New Study Shows 'Best States for Millennials'
 A new study by WalletHub used “30 key metrics, ranging from share of millennials to millennial unemployment rate to millennial voter-turnout rate” to find out which states are the ‘Best States for Millennials.’ The Top 5 Best States for Millennials are:
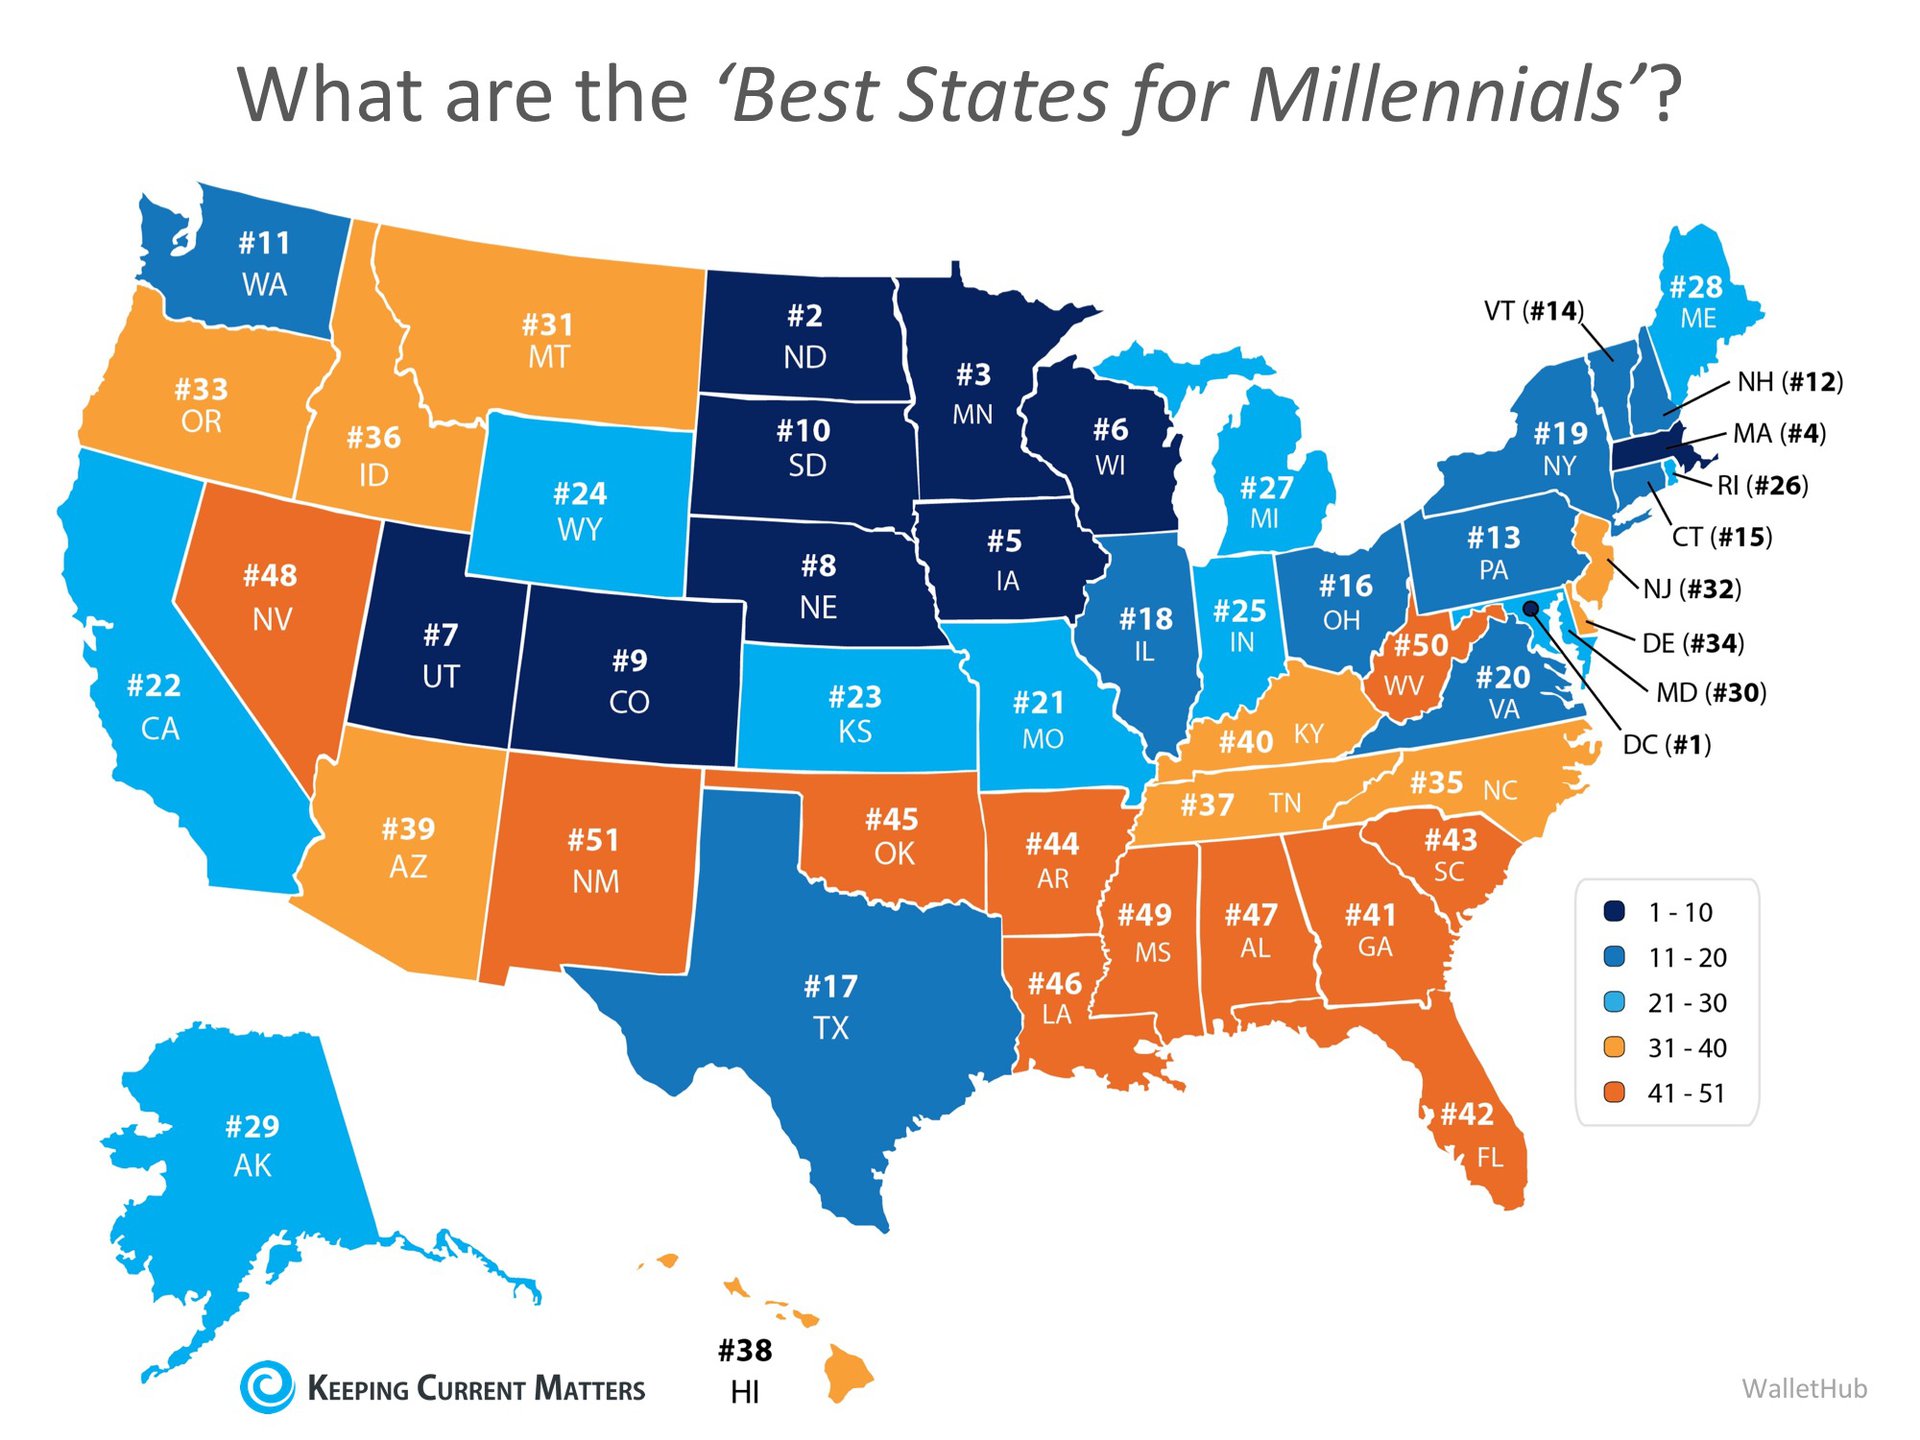
Below is a map with the rankings for each of the 50 states: We recently reported on a study that set out to find out “How Much You Need to Make to Buy a Home in Your State,” which may have left you wondering what the average salaries are in each of the five states listed above. According to WalletHub’s research, the top 5 states with the Highest Average Millennial Salaries are:
Every day, more and more millennials are aging into the ‘Responsibility Zone,’ the time in their lives when their responsibilities start to dictate their behaviors. For many, this includes buying a home. The top 5 states with the Highest Millennial Homeownership Rate are:
Bottom LineIf owning a home is next on your list, meet with a local real estate professional who can answer your questions and set you on the path to homeownership! |
Is Family Mortgage Debt Out of Control?
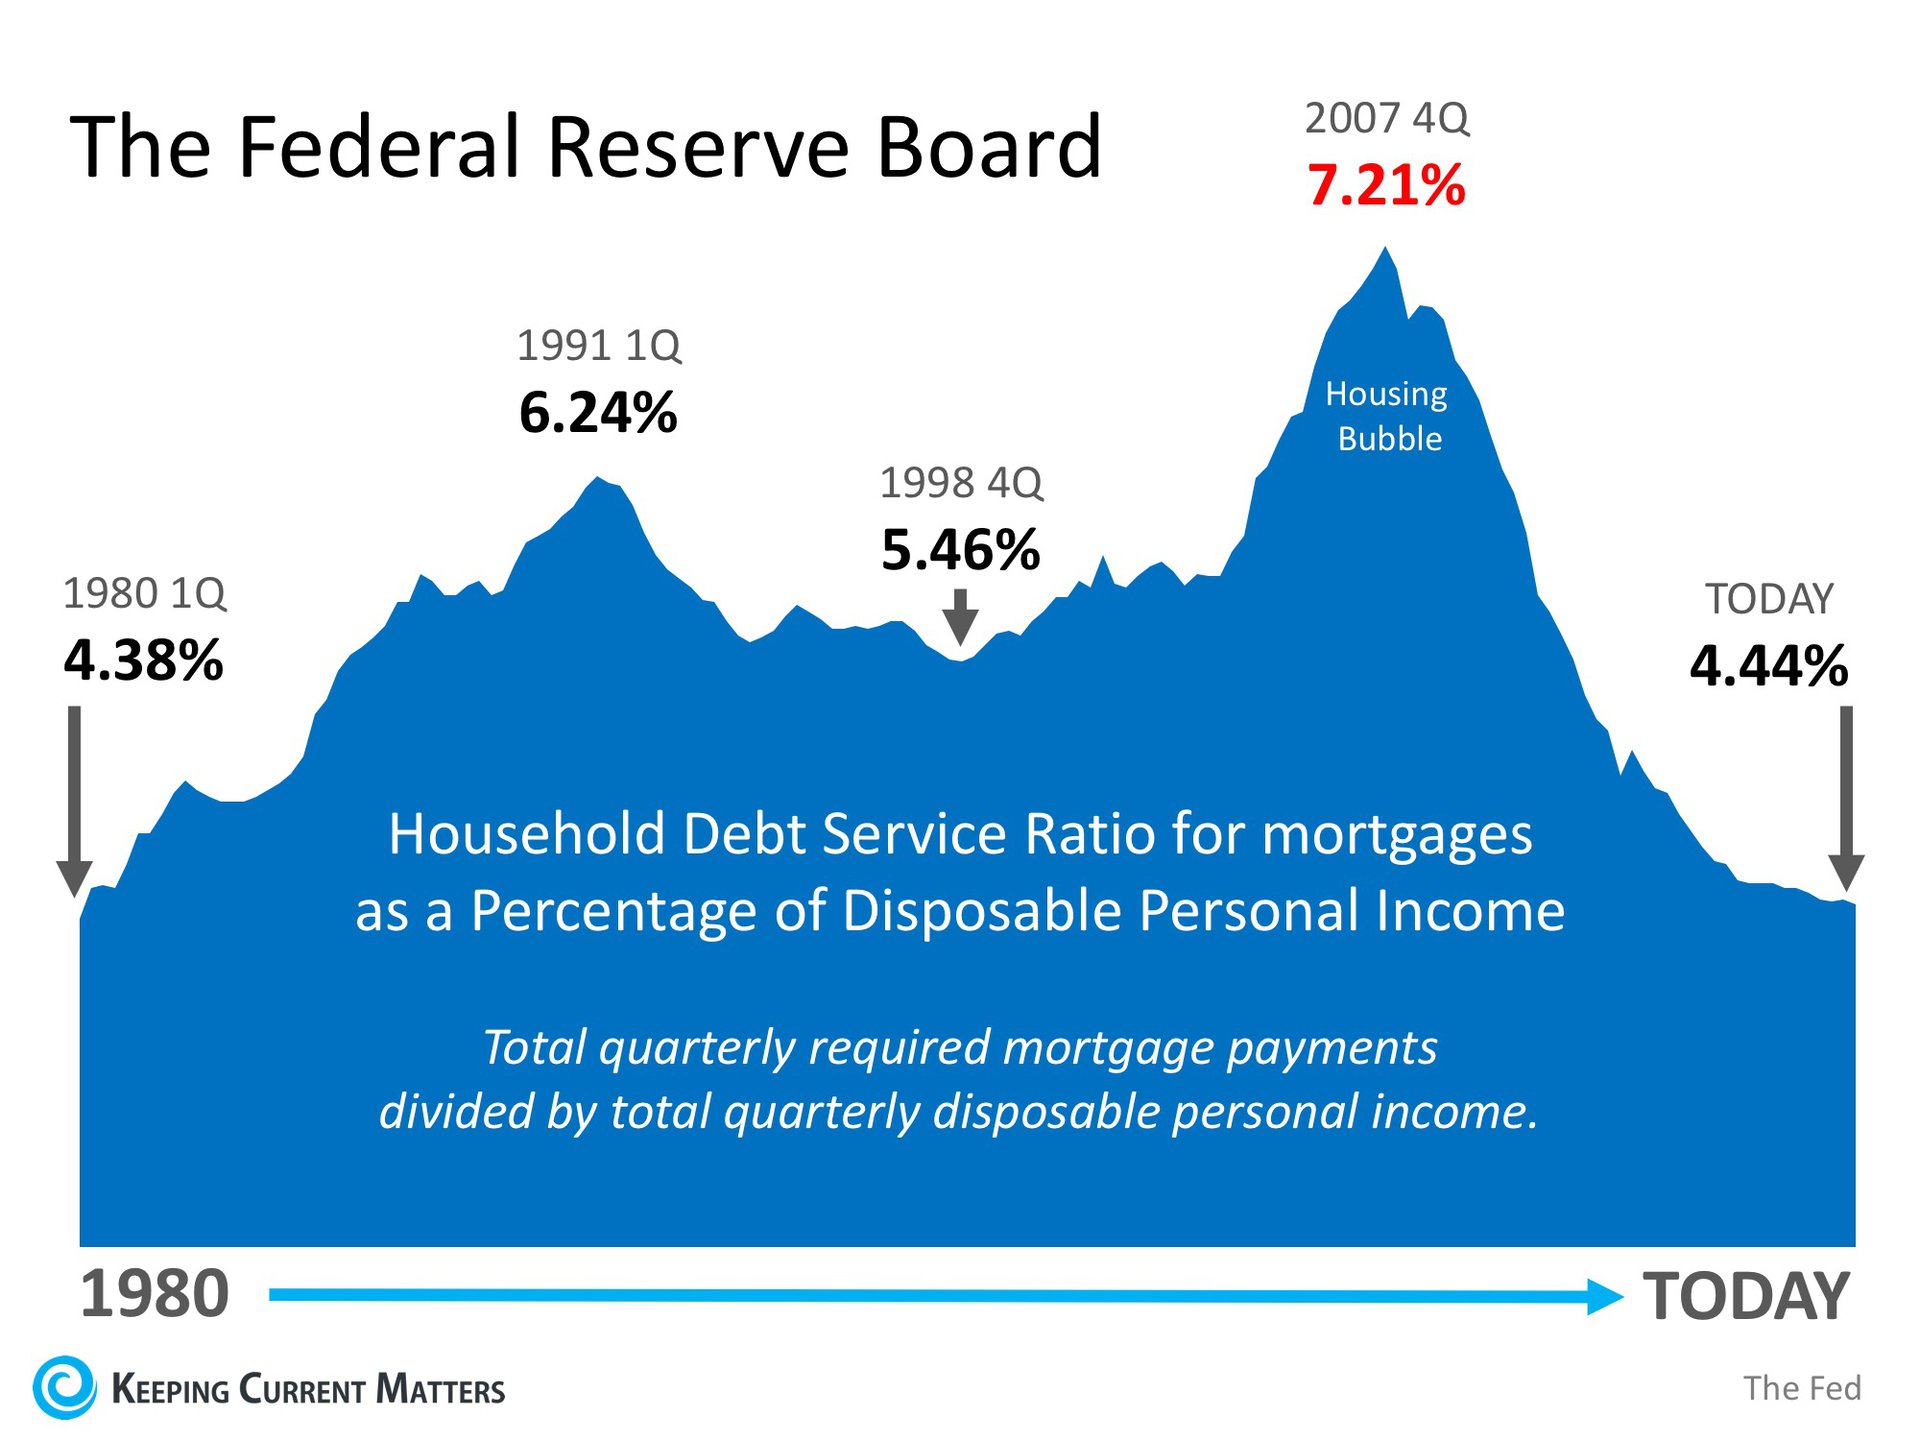
 Some homeowners have recently done a “cash out” refinance and have taken a portion of their increased equity from their house. Others have sold their homes and purchased more expensive homes with larger mortgages. At the same time, first-time buyers have become homeowners and now have mortgage payments for the first time. These developments have caused concern that families might be reaching unsustainable levels of mortgage debt. Some are worried that we may be repeating a behavior that helped precipitate the housing crash ten years ago. Today, we want to assure everyone that this is not the case. Here is a graph created from data released by the Federal Reserve Board which shows the Household Debt Service Ratio for mortgages as a percentage of disposable personal income. The ratio is the total quarterly required mortgage payments divided by total quarterly disposable personal income. In other words, the percentage of spendable income people are using to pay their mortgage. Today’s ratio of 4.44% is nowhere near the ratio of 7.21% during the peak of the housing bubble and is instead at the lowest rate since 1980 (4.38%). Bill McBride of Calculated Risk recently commented on the ratio:
Bottom LineMany families paid a heavy price because of questionable practices that led to last decade’s housing crash. It seems the American people have learned a lesson and are not repeating that same behavior regarding their mortgage debt. |
Rising Prices Help You Build Your Family's Wealth?
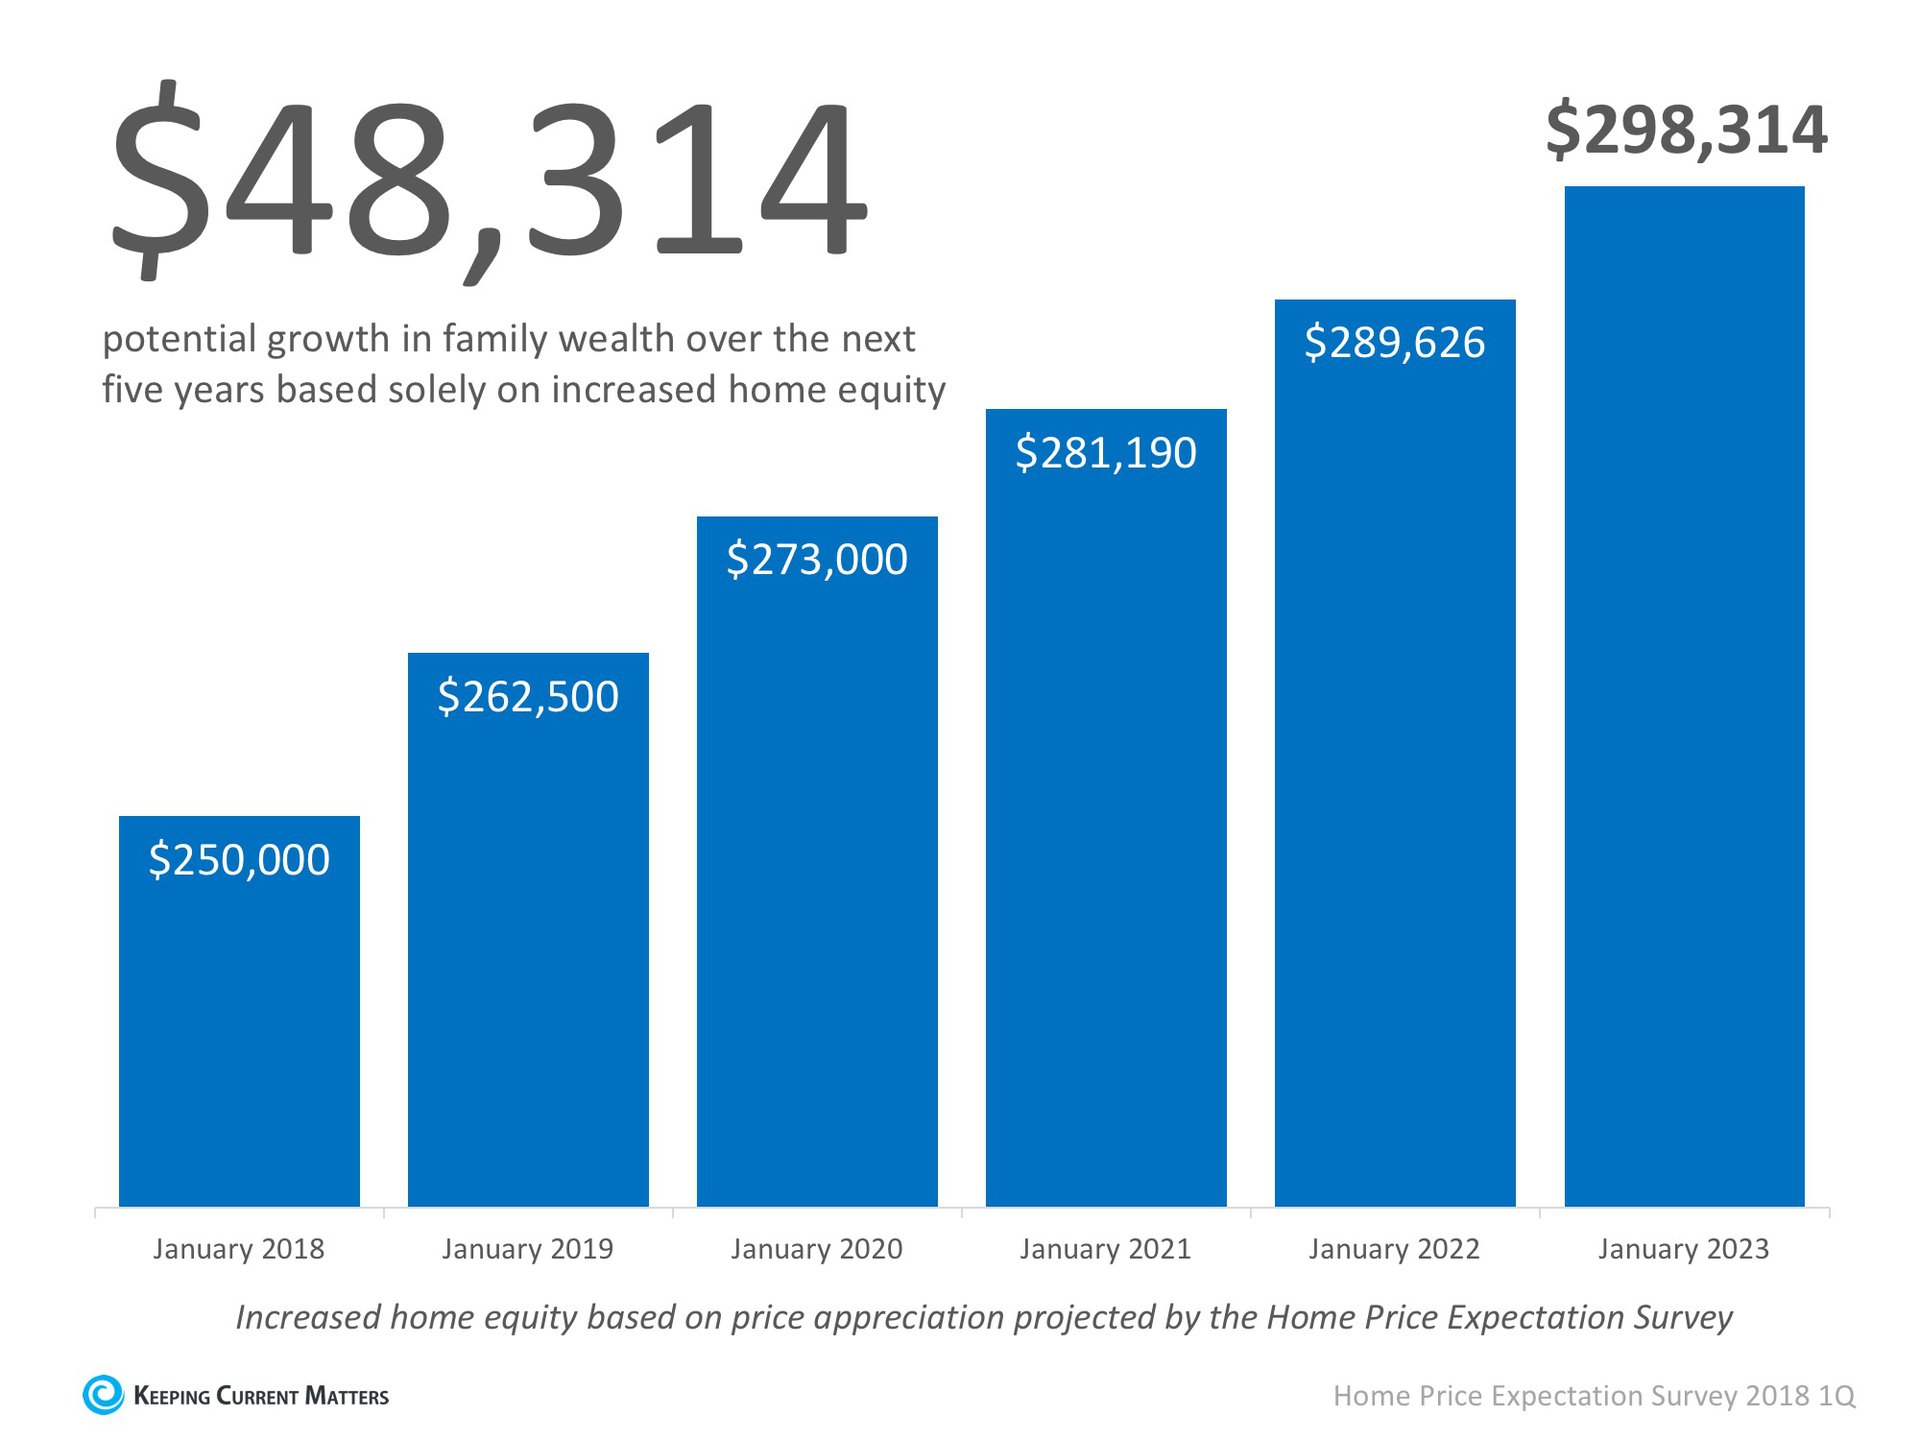
 Over the next five years, home prices are expected to appreciate, on average, by 3.6% per year and to grow by 18.2% cumulatively, according to Pulsenomics’ most recent Home Price Expectation Survey. So, what does this mean for homeowners and their equity position?As an example, let’s assume a young couple purchased and closed on a $250,000 home this January. If we only look at the projected increase in the price of that home, how much equity will they earn over the next 5 years? Since the experts predict that home prices will increase by 5.0% in 2018, the young homeowners will have gained $12,500 in equity in just one year. Over a five-year period, their equity will increase by over $48,000! This figure does not even take into account their monthly principal mortgage payments. In many cases, home equity is one of the largest portions of a family’s overall net worth. Bottom LineNot only is homeownership something to be proud of, but it also offers you and your family the ability to build equity you can borrow against in the future. If you are ready and willing to buy, find out if you are able to today!
|
Getting Pre-Approved Should Always Be Your First Step
 In many markets across the country, the number of buyers searching for their dream homes greatly outnumbers the number of homes for sale. This has led to a competitive marketplace where buyers often need to stand out. One way to show you are serious about buying your dream home is to get pre-qualified or pre-approved for a mortgage before starting your search. Even if you are in a market that is not as competitive, understanding your budget will give you the confidence of knowing if your dream home is within your reach. Freddie Mac lays out the advantages of pre-approval in the ‘My Home’ section of their website:
One of the many advantages of working with a local real estate professional is that many have relationships with lenders who will be able to help you with this process. Once you have selected a lender, you will need to fill out their loan application and provide them with important information regarding “your credit, debt, work history, down payment and residential history.” Freddie Mac describes the ‘4 Cs’ that help determine the amount you will be qualified to borrow:
Getting pre-approved is one of many steps that will show home sellers that you are serious about buying, and it often helps speed up the process once your offer has been accepted. Bottom LineMany potential home buyers overestimate the down payment and credit scores needed to qualify for a mortgage today. If you are ready and willing to buy, you may be pleasantly surprised at your ability to do so.
|
The COST of Your Next Home Will Be LESS Than Your Parents' Home Was?
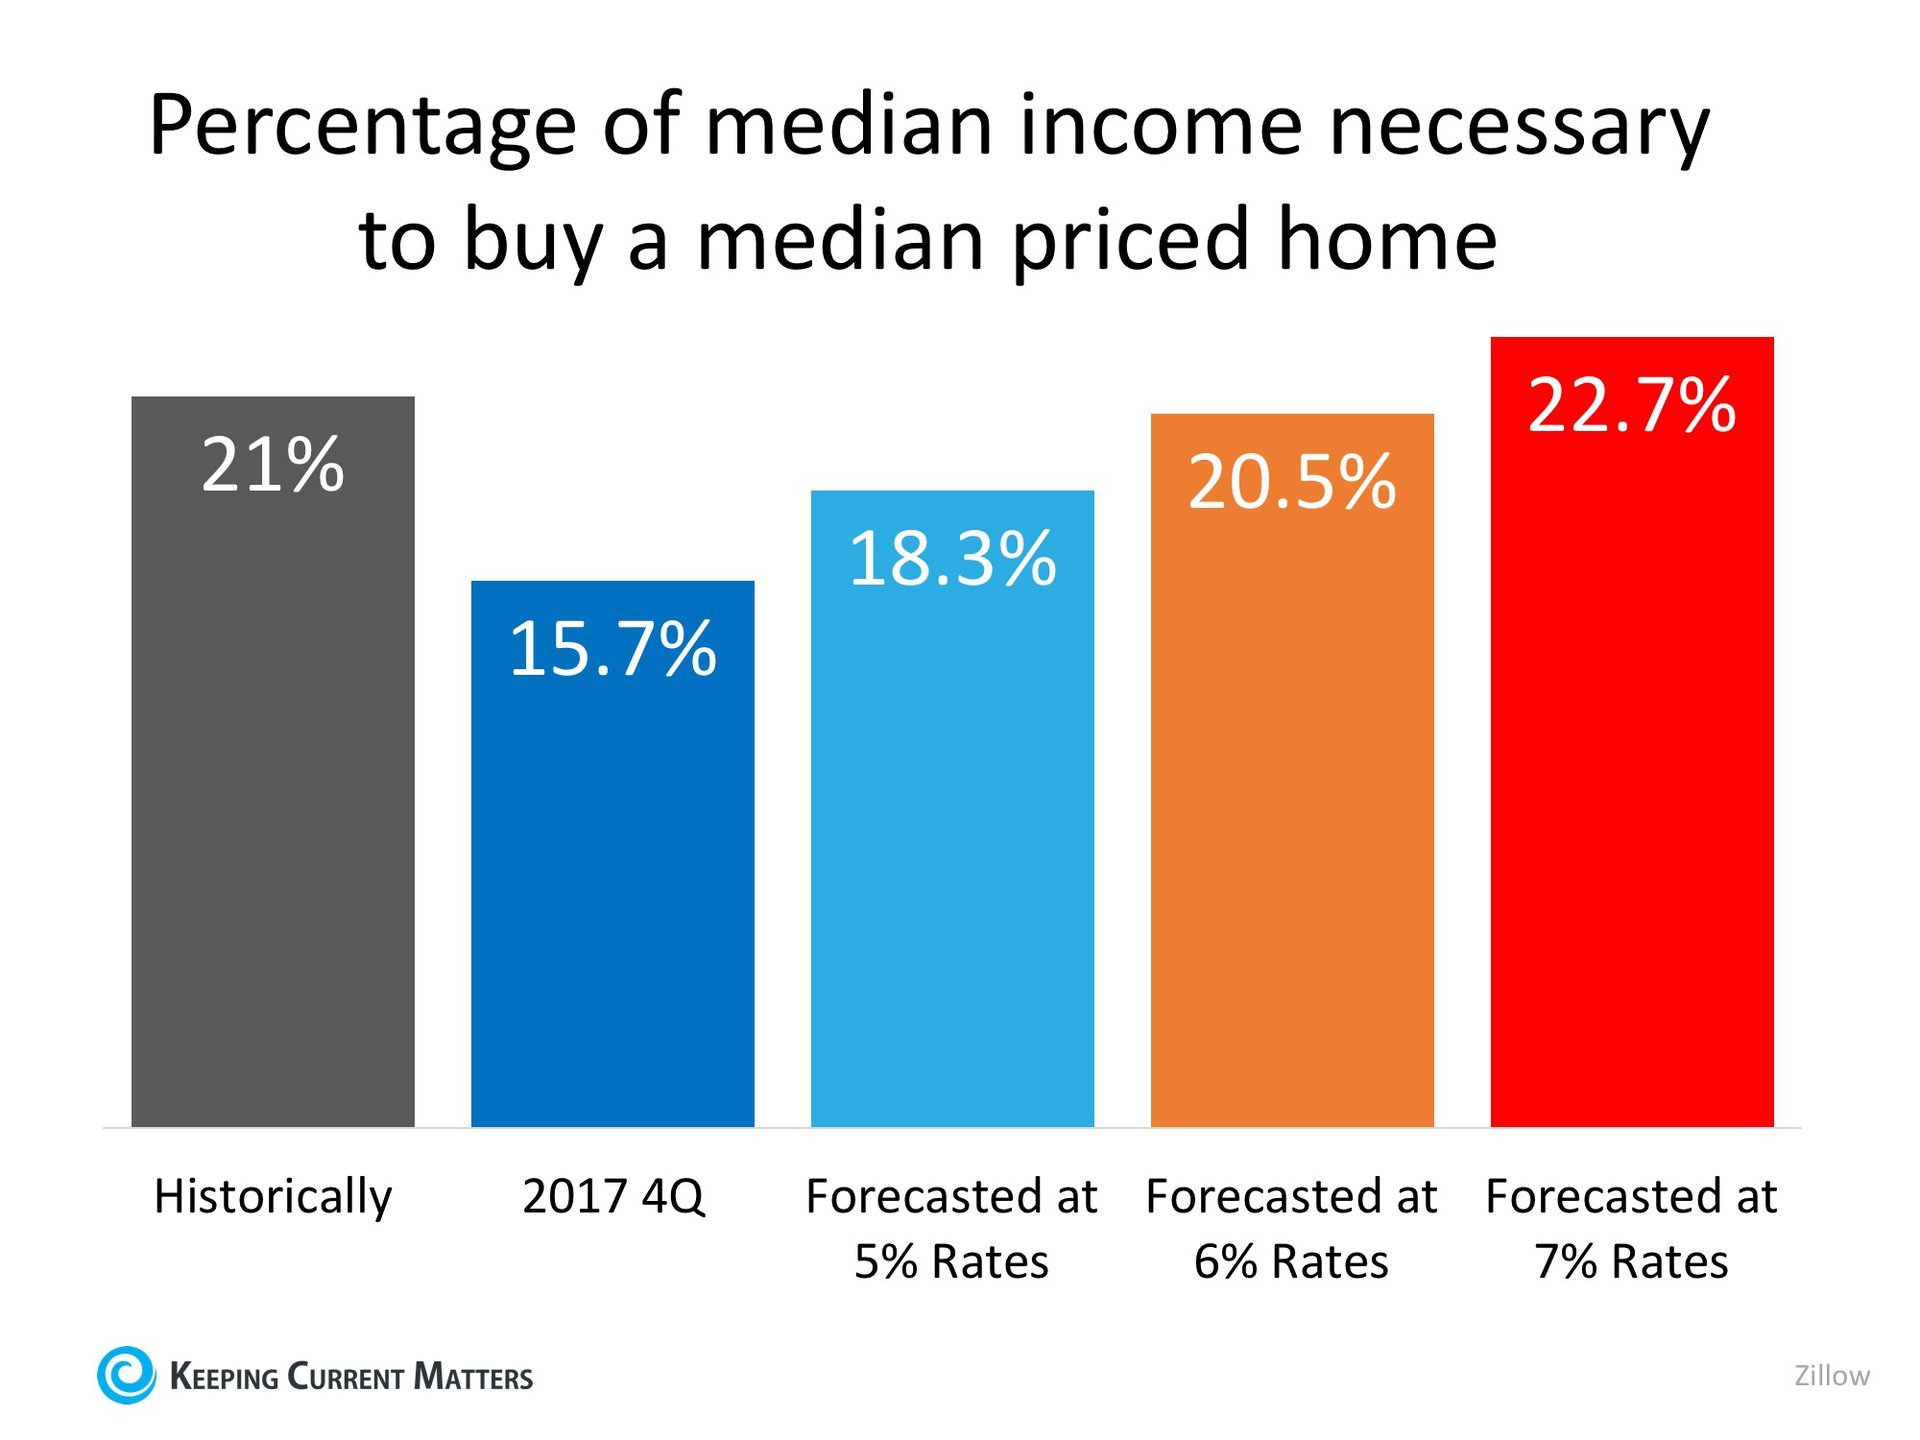
 There is no doubt that the price of a home in most regions of the country is greater now than at any time in history. However, when we look at the cost of a home, it is cheaper to own today than it has been historically. The Difference Between PRICE and COSTThe price of a home is the dollar amount you and the seller agree to at the time of purchase. The cost of a home is the monthly expense you pay for your mortgage payment. To accurately compare costs in different time periods, we must look at home prices, mortgage rates, and wages during each period. Home prices were less expensive years ago, but paychecks were also smaller and mortgage rates were much higher (the average mortgage interest rate in 1988 was 10.34%). The best way to measure the COST of a home is to determine what percentage of income is necessary to buy a home at the time. That would take into account the price of the home, the mortgage interest rate and wages at the time. Zillow just released research that examined home costs using this formula. The research compares the historic percentage of income necessary to afford a mortgage to the percentage needed today. It also revealed the cost if mortgage rates continue to rise as experts are predicting. Here is a graph of their findings*: Rates would need to jump to 7% in order for the percentage of necessary income to be greater than historic norms. Bottom LineWhether you are a homeowner considering selling your current house and moving up to the home of your dreams, or a first-time buyer trying to purchase your first home, it’s a great time to move forward. *Assumptions in the Zillow report: Buyer puts 20% down, takes out a conforming, 30-year fixed-rate mortgage at rates prevailing at the time, earns the median household income, and is buying a median-valued home. |